Debugging
Debugging with Scala CLI is very simple. All one needs to do is to pass the --debug option, which is available for the run and test sub-commands.
Preparing files to debug
Let's start with creating a few example files, which we will run and debug later on:
object MyClass extends App  {
  println("Line 1")
  println("Line 2")
  println("Line 3")
}
//> using dep org.scalameta::munit::1.0.2

class MyTests extends munit.FunSuite {
  test("foo") {
    assert(2 + 2 == 4)
  }
}
VS Code with Metals
Configuration
If you are using VS Code with Metals, you will have to define launch configurations in the launch.json file inside the .vscode directory.
Within each configuration you will have to define the following configuration attributes: type, request, name, buildTarget, hostName and port.
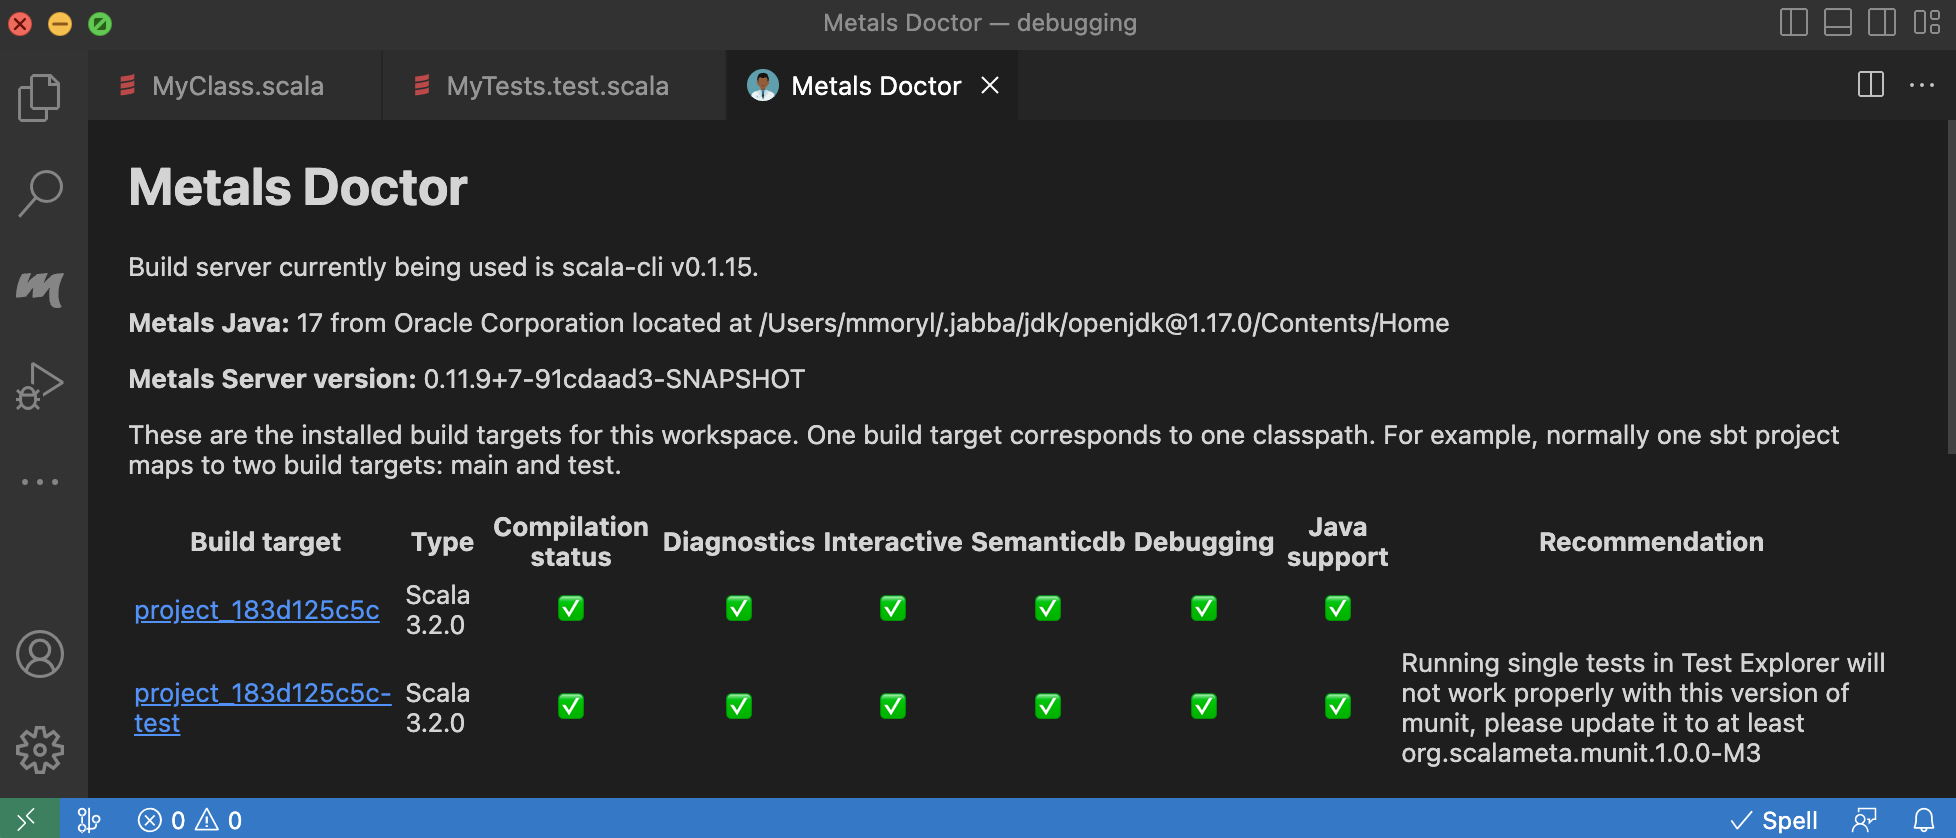
If you don't know what are the exact build target names of your project, you can check them in Metals Doctor in the Build target column:
If no build targets have been found, perform the following steps:
- run
scala-cli compile .in the command line. - when the compilation is complete, run
Connect to build serverin the Metals build commands section.
After these steps, build targets should be visible in the Metals Doctor view.
Example launch.json configuration file:
{
  "version": "0.2.0",
  "configurations": [
    {
      "type": "scala",
      "request": "attach",
      "name": "project",
      "buildTarget": "project_183d125c5c",
      "hostName": "localhost",
      "port": 5005
    },
    {
      "type": "scala",
      "request": "attach",
      "name": "project-test",
      "buildTarget": "project_183d125c5c-test",
      "hostName": "localhost",
      "port": 5005
    }
  ]
}
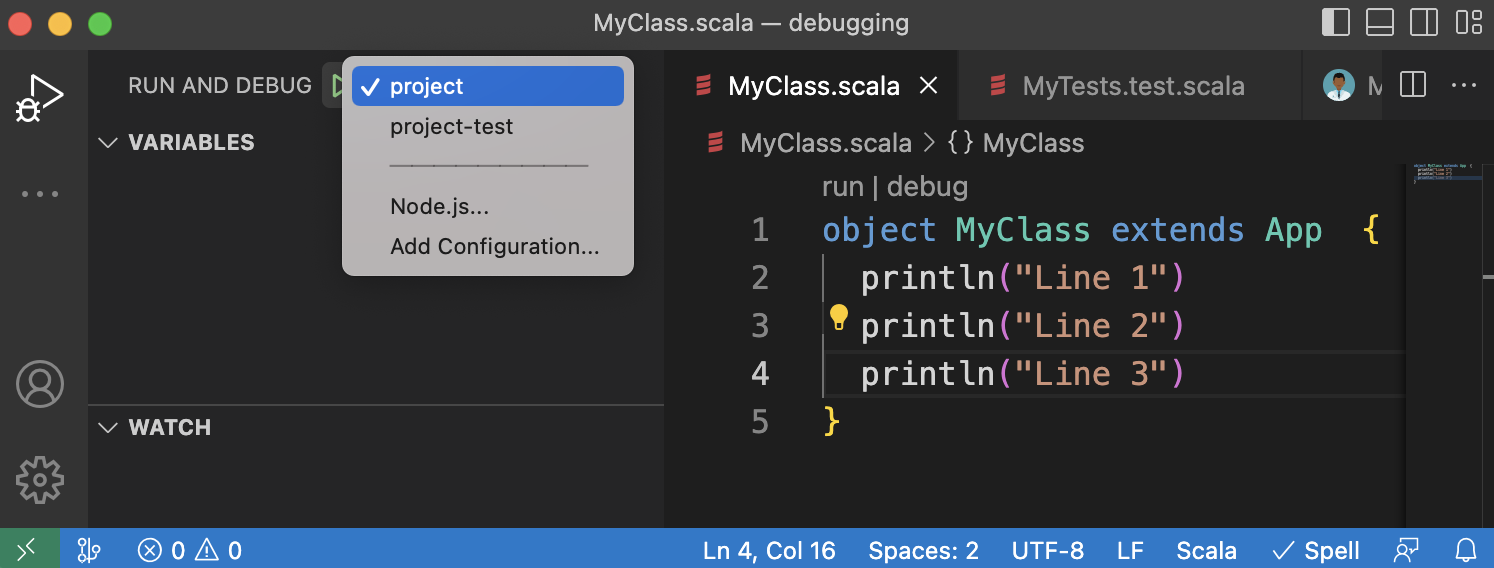
After defining configurations in the launch.json file, you should be able to see them in Configuration dropdown in the Run and Debug view:
After setting up the configuration you can proceed to debugging.
Debugging
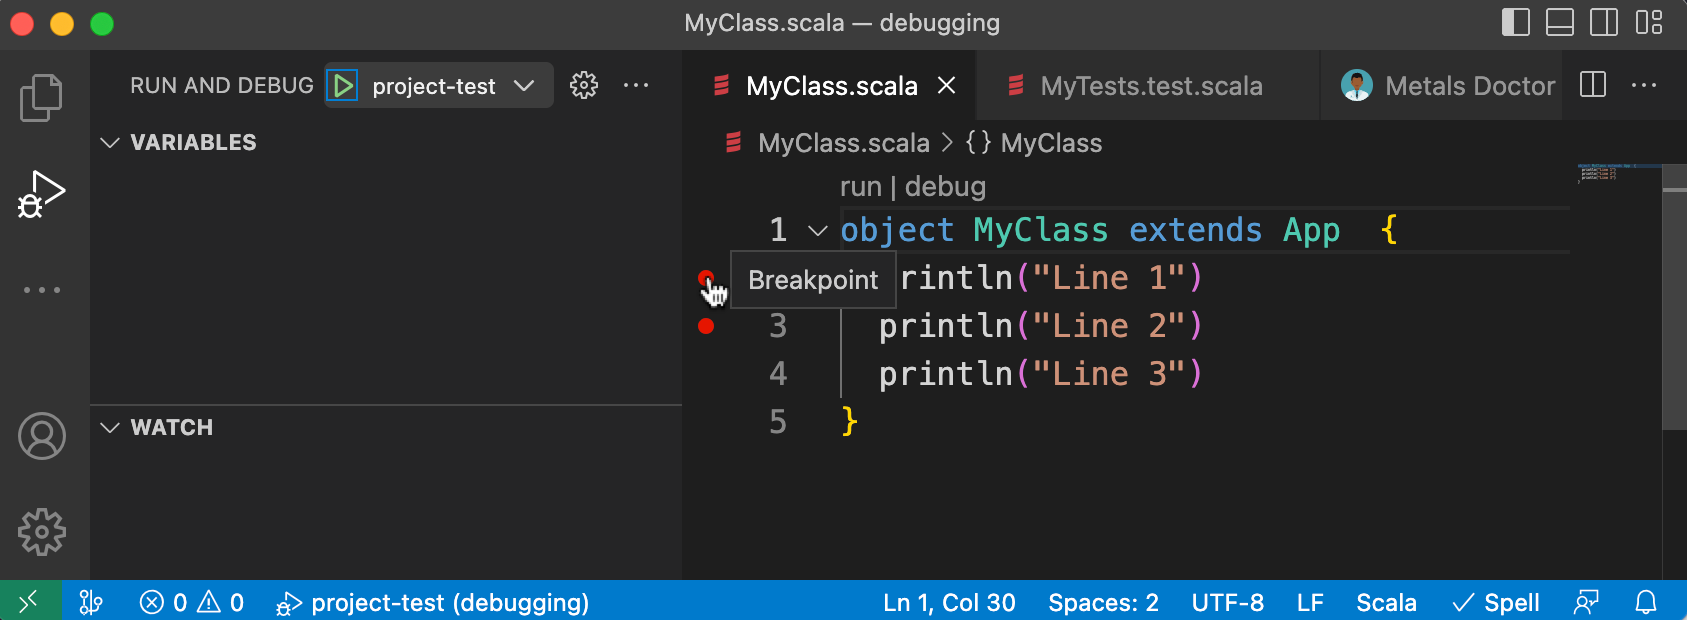
Set breakpoints for the file you would like to debug:
Run one of the following commands depending on which file you would like to debug:
- run
scala-cli MyClass.scala --debugif you would like to debugMyClass.scalafile - run
scala-cli test MyTests.test.scala --debugif you would like to debugMyTests.test.scalafile
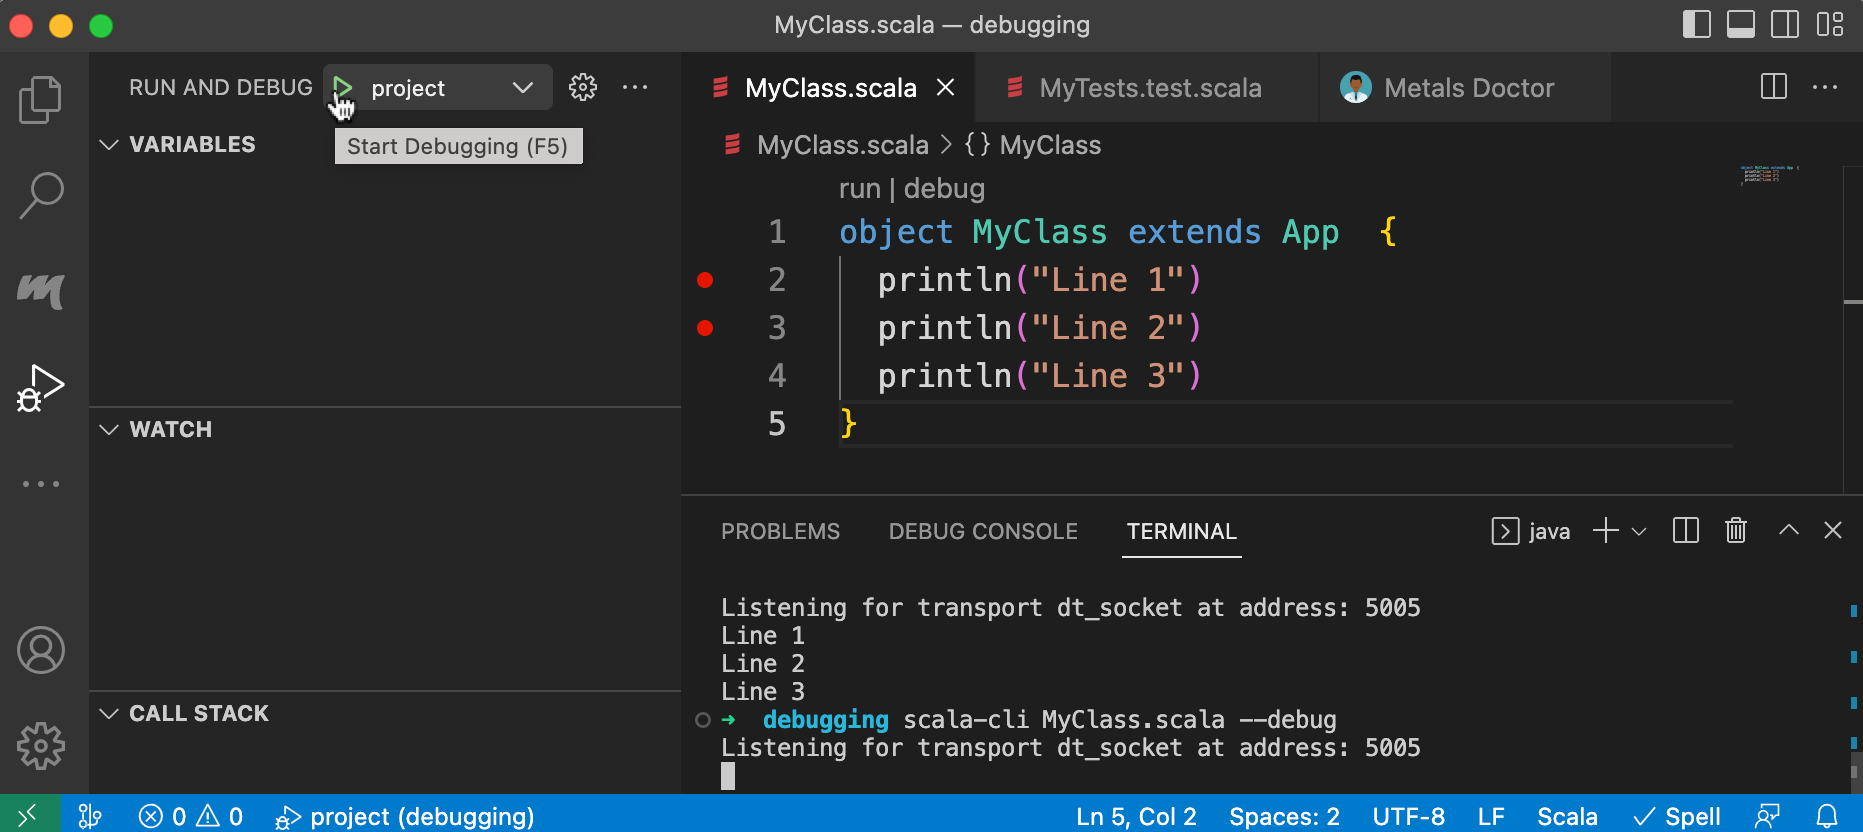
After compilation is completed, Scala CLI should stop and listen for transport dt_socket at port 5005.
Please note that 5005 is the default port for debugging with scala-cli. You can always change it by passing --debug-port option.
At this moment go to the Run and Debug view, select proper configuration from the Configuration dropdown and run debugger by clicking green arrow on the side:
After all these steps, the debugger should stop at the first breakpoint and you can proceed to debugging your code using all features delivered by VS Code. For more information check this guide.
IntelliJ IDEA
Debugging in the attach mode
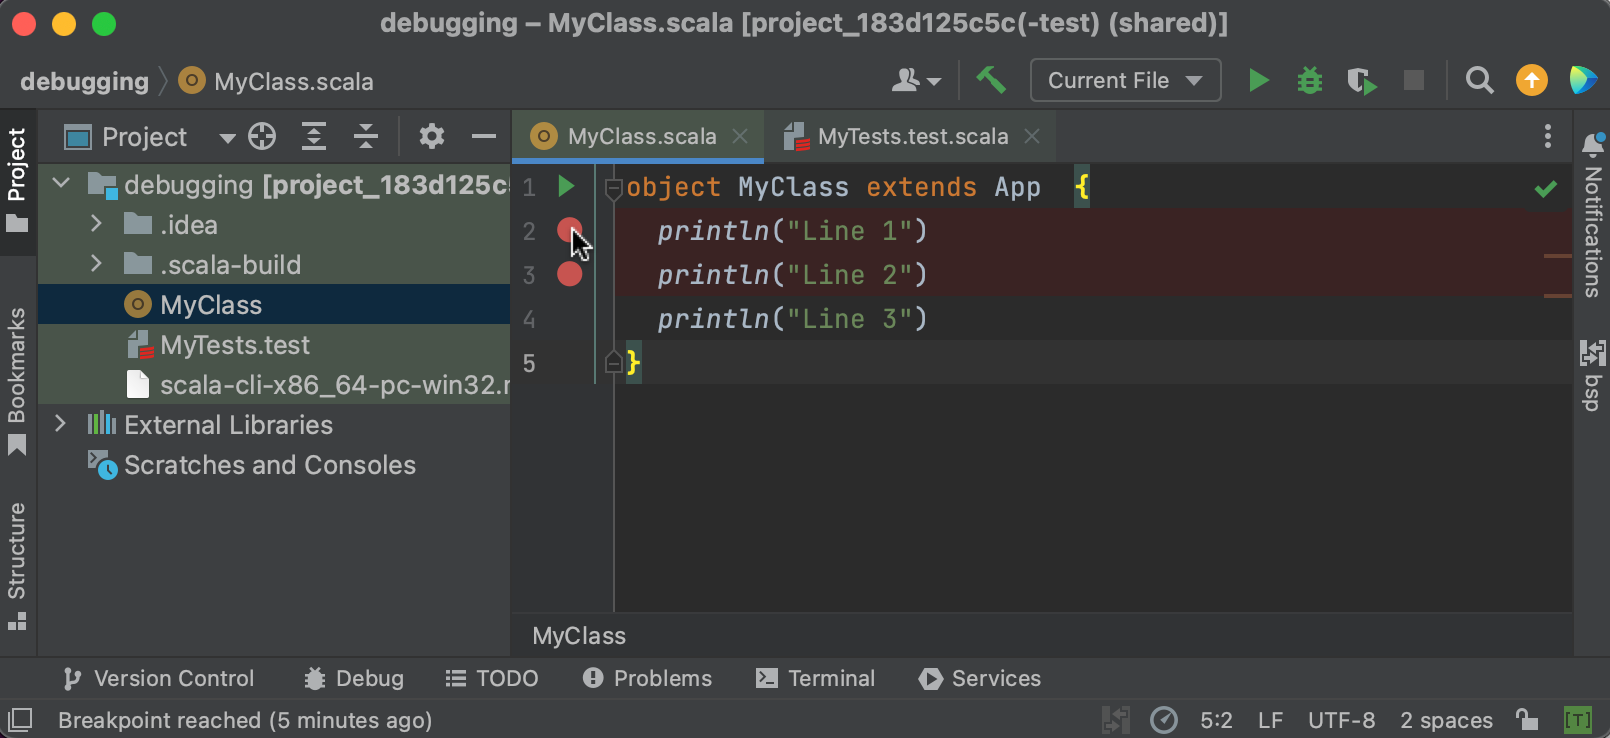
The first thing that you need to do to start debugging is setting breakpoints for the files you want to debug:
Run one of the following commands depending on which file you would like to debug:
- run
scala-cli MyClass.scala --debugif you would like to debugMyClass.scalafile - run
scala-cli test MyTests.test.scala --debugif you would like to debugMyTests.test.scalafile
After compilation is completed, Scala CLI should stop and listen for transport dt_socket at port 5005.
Please note that 5005 is the default port for debugging with scala-cli. You can always change it by passing --debug-port option.
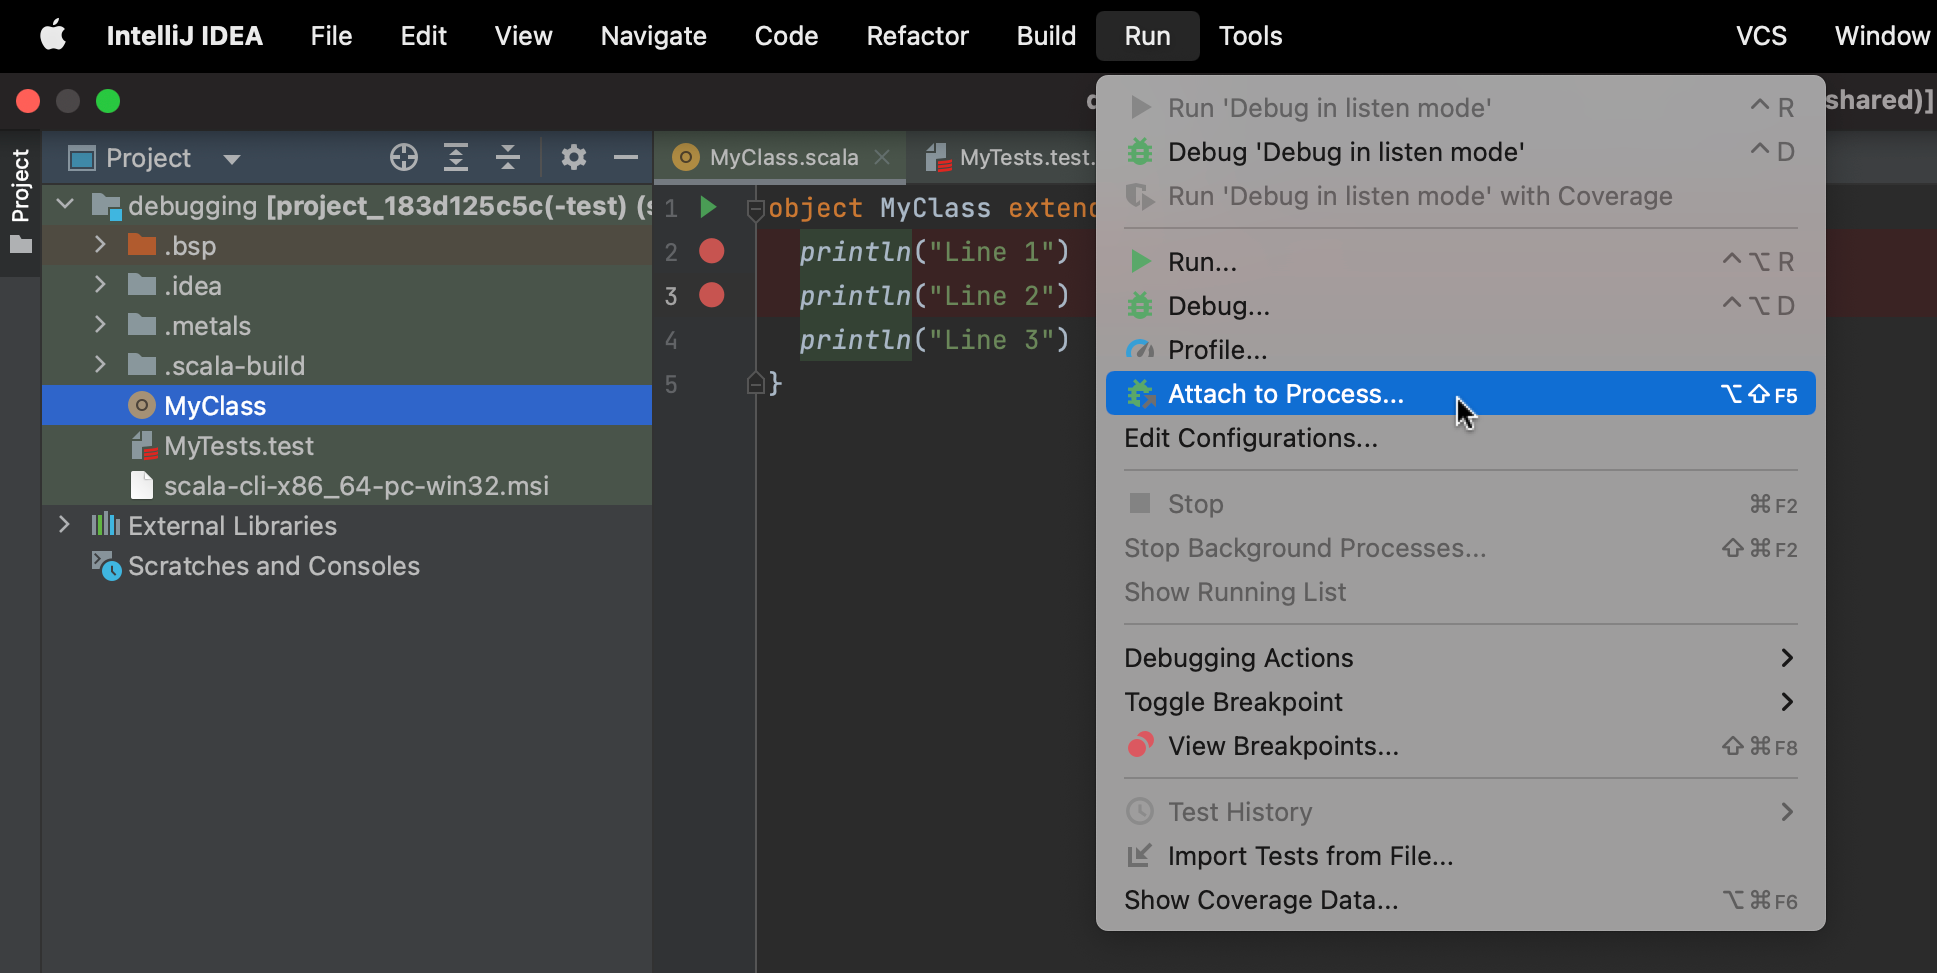
At this moment, you can attach to process by clicking Run -> Attach to Process and choosing process, which is running at port 5005:
After all these steps, the debugger should stop at the first breakpoint and you can proceed to debug your code using all features delivered by IntelliJ IDEA. For more information check this guide.
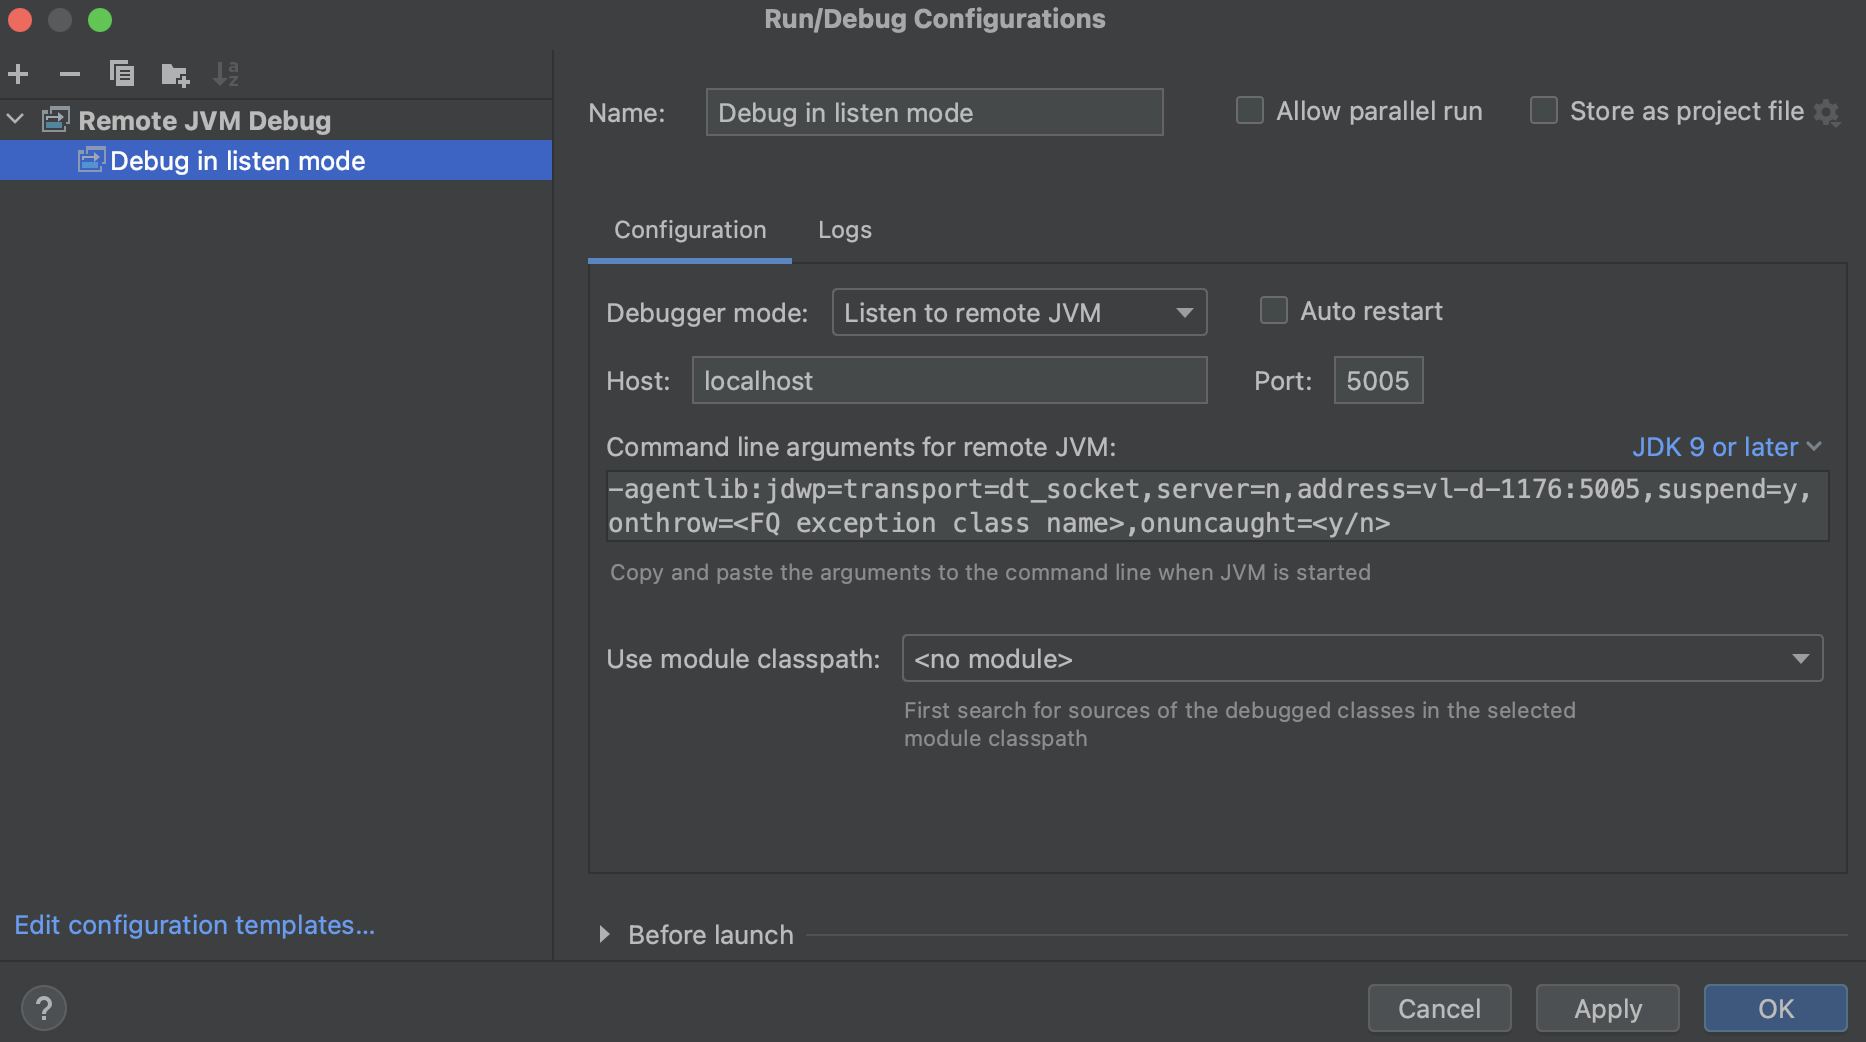
Debugging in the listen mode
If you would like to debug in listen mode, add a new Remote JVM Debug configuration with the following setup:
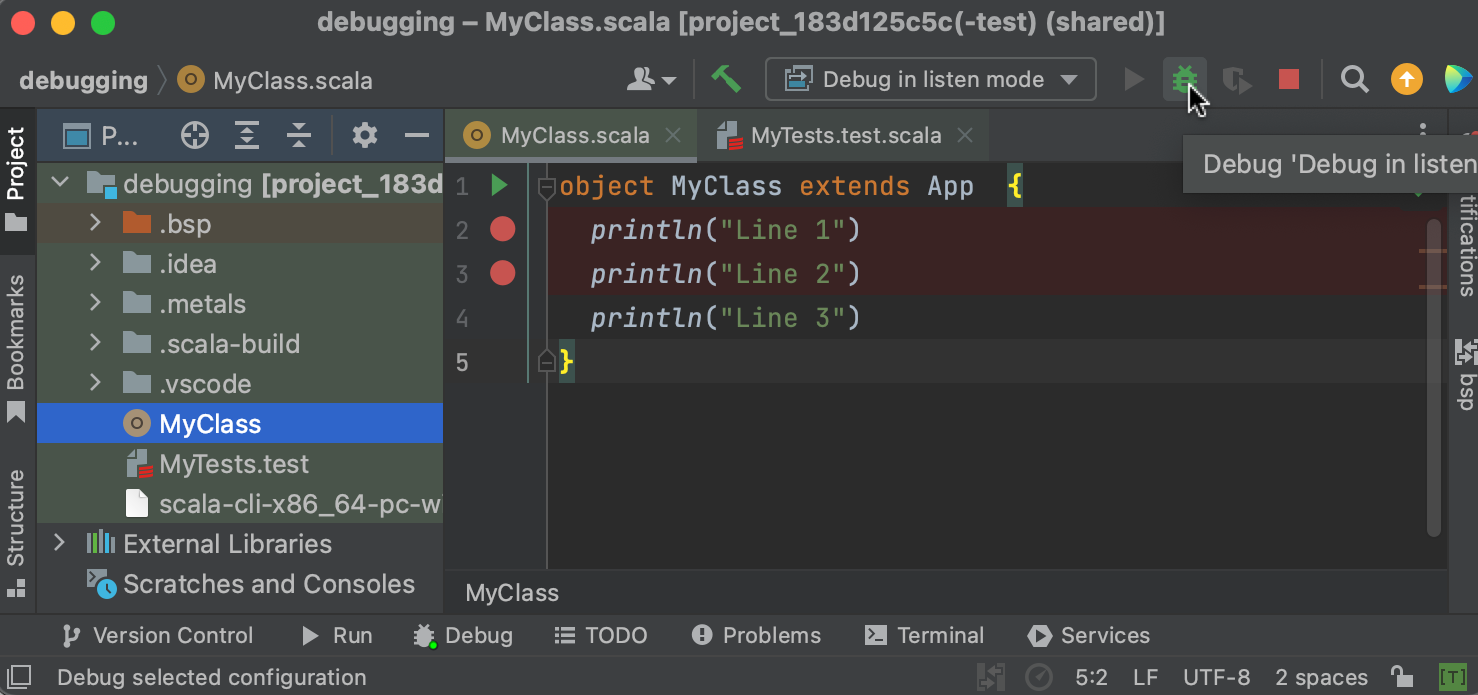
Set breakpoints for the files you want to debug:
Run the previously set configuration by clicking on the green debug button on the side:
Run one of the following commands depending on which file you would like to debug:
- run
scala-cli MyClass.scala --debug-mode listenif you would like to debugMyClass.scalafile - run
scala-cli test MyTests.test.scala --debug-mode listenif you would like to debugMyTests.test.scalafile
attach is the default mode for debugging with Scala CLI. You can always change it by passing --debug-mode option. Available modes are: attach and listen.
After all these steps the debugger should stop at the first breakpoint and you can proceed to debug your code using all features delivered by IntelliJ IDEA. For more information check this guide.